
A Smarter Way to Use Smart Beta ETFs
There are many “smart beta” ETFs that claim to offer market-beating return potential. These funds are based upon academic research regarding characteristics or “factors” that have historically produced risk-adjusted excess return. Which ones should you use? And as important, when should you use them? This article seeks to help answer these important questions.
Factor Investing
I have always been a factor-based investor. When I was managing institutional portfolios and hedge funds in the 80s, 90s, and 00s, I would invest in stocks, but really what I was doing was investing in their characteristics or “factors.” For example, if I was looking for value, I would use various ways of capturing and measuring that characteristic, such as low price/earnings, low price/revenues, or low price/free cash flow. Each of those three ratios is a “factor.” If I combined them, the result would be a “composite factor” that I might call my “value factor.” Other factors I tended to use included positive earnings estimate revisions, high earnings quality, and heavy insider buying, to name just a few.
The ideas for using these factors came from published research by academics and practitioners. I still spend quite a lot of my time reading white papers, journal articles, and books on the subject of investing. I get particularly excited over findings of market efficiencies that are systematically exploitable. I’m nerdy that way.
Factor investors like me do not like stock-specific risk. We prefer to diversify it away by holding many stocks that have the factor exposures that we desire. I would usually have hundreds of stocks in my portfolios. Adding a new factor exposure would typically involve buying dozens of stocks with a high “loading” on the desired factor. I kept my trading and operations staff pretty busy.
Smart Beta ETFs
I sold my firm to a bank and eventually left to start something new. It was 2012, and the ETF explosion was well underway. Now, instead of having to trade dozens of stocks to get a diversified factor exposure, I could just click a mouse and buy a factor ETF! These factor-based ETFs began to be called “smart beta” ETFs because they provided exposure (“beta”) to a particular factor or set of factors that were supposed to be “smart” in that they would hopefully provide risk-adjusted excess return.
A lot of these smart beta ETFs were fairly new at that point, so they did not have much return history. However, they were all passively managed index funds, and their ETF sponsors usually published the history of the underlying indexes. Armed with a Bloomberg subscription, I could download the historical return of the underlying index, subtract the expense ratio, and get “pro-forma” return history for the ETF, even if it was brand new.
Of course, the ETF sponsors have an incentive to show a favorable return history for the underlying index. They can slant things in two ways. The first is in selecting the historical period to publish. They can start the return history right after an unfavorable period and/or right before a favorable period. The second is to play with the index methodology. Now, most ETF index providers are well-known index firms, like MSCI, S&P, Dow Jones, and Russell, and they are not likely to be aggressive in this area. Most ETF sponsors pay a recognized index firm like these four to construct their indexes. However, some ETF sponsors provide their own indexes, and they are much more likely to fine tune their methodology to produce outstanding historical index returns that may not hold up in practice going forward.
On top of these two concerns, there is a well-known “publication effect” that can dampen the returns to a factor after it has been published about and is starting to be widely exploited. By the time an ETF is launched based upon a factor, it has undoubtedly been heavily mined for returns and may be partially arbitraged away. This problem will apply to different factors to different degrees, but it is a concern for all of them.
7 Factor ETFs
To illustrate these issues, and test for possible solutions, I selected seven factor ETFs to study. Five of the factors would be considered the “usual suspects” for smart beta: size, value, low volatility, momentum, and quality. I added two more to broaden the scope of the study: buyback and dividend yield. All seven factors capture well-documented return anomalies in the literature.
All seven funds, with the possible exception of the buyback ETF (which is a favorite factor of mine), are very large, liquid, and cheap. In my opinion, these are three important criteria for selecting factor ETFs. The earliest inception dates are in late 2011 and the latest in early 2015. All seven have underlying index histories that go much further back in time, providing the possibility of constructing “pro-forma” return histories by subtracting the expense ratio from the index.
| 7 Factor ETFs | ||||||||
| Strategy | Fund Name | Fund Ticker | Total AUM ($ Mil) | Expense Ratio | Bid-Ask Spread % | Fund Inception | ||
| Size | iShares Edge MSCI USA Size Factor ETF | SIZE | 393 | 0.15% | 0.11% | 04/16/2013 | ||
| Value | iShares Edge MSCI USA Value Factor ETF | VLUE | 3,355 | 0.15% | 0.03% | 04/16/2013 | ||
| Buyback | SPDR S&P 500 Buyback ETF | SPYB | 19 | 0.35% | 0.22% | 02/04/2015 | ||
| Div Yield | Schwab US Dividend Equity ETF | SCHD | 9,147 | 0.06% | 0.02% | 10/20/2011 | ||
| Min Vol | iShares Edge MSCI Min Vol USA ETF | USMV | 27,579 | 0.15% | 0.02% | 10/18/2011 | ||
| Momentum | iShares Edge MSCI USA Momentum Factor ETF | MTUM | 8,519 | 0.15% | 0.03% | 04/16/2013 | ||
| Quality | PowerShares S&P 500 Quality Portfolio | SPHQ | 1,393 | 0.15% | 0.04% | 12/06/2005 | ||
The graph below shows the return history of an equal-weighted portfolio of all 7 ETFs. “Live” returns of funds are used when available. Returns for earlier time periods are based upon “pro-forma” returns using their underlying indexes and expense ratios. The tendency for the performance of factor ETFs to fade after their inception dates relative to the previous historical returns of their underlying indexes is striking. The slope of the “live” performance period starting in 2015 has been essentially flat compared to the noticeable upward slope of the earlier “pro-forma” period.

Note that in the graph above what is being measured (the vertical axis) is not total return but rather “residual return.” The distinction is vital. When investing in a factor ETF, what is desired is “risk-adjusted excess return.” To clearly distinguish risk-related return from risk-adjusted (or “residual”) return requires the use of some sort of risk model. The simplest risk adjustment would be to subtract the market return from the each of the 7 factor ETF returns. Since they are all U.S. equity ETFs, the obvious choice for the market would be the S&P 500.
However, not all of the ETFs would be expected to have an S&P 500 beta of one. Some, such as the minimum volatility ETF, and to a lesser extent, the dividend yield ETF, might reasonably be expected to have a beta quite a bit lower than one. At Sapient Investments, we use a proprietary robust estimate of market beta to disentangle risk-related return from residual return. Our measure of residual return could also be called “alpha.”
The table below provides summary statistics for the 7 factor ETFs since 12/31/2014, which we might call the “live” period. The annualized average residual return for this period was -.11%. By contrast, the annualized average residual return from index inception to 12/31/2014, which we might call the “pro-forma” period, was 2.30%. Quite a difference!
| 7 Factor ETFs Summary Data | ||||||||||
| Strategy | Size | Value | Buyback | Div Yield | Min Vol | Momentum | Quality | Avg | ||
| Fund Name | iShares Edge MSCI USA Size Factor ETF | iShares Edge MSCI USA Value Factor ETF | SPDR S&P 500 Buyback ETF | Schwab US Dividend Equity ETF | iShares Edge MSCI Min Vol USA ETF | iShares Edge MSCI USA Momentum Factor ETF | PowerShares S&P 500 Quality Portfolio | |||
| Fund Ticker | SIZE | VLUE | SPYB | SCHD | USMV | MTUM | SPHQ | |||
| Stats Since 12/31/2014: | ||||||||||
| Avg S&P 500 Beta | 0.92 | 1.01 | 1.10 | 0.93 | 0.80 | 0.97 | 0.88 | |||
| Annlzd Avg Resid Rtrn | -0.87% | -0.27% | -0.24% | 0.03% | 0.25% | 0.26% | 0.09% | -0.11% | ||
| Annlzd Std Dev RR | 3.40% | 1.15% | 1.43% | 1.06% | 0.98% | 1.64% | 0.96% | |||
| Benchmark Index | MSCI USA Low Size | MSCI USA Enhanced Value | S&P 500 Buyback | Dow Jones U.S. Dividend 100 | MSCI USA Minimum Volatility | MSCI USA Momentum | S&P 500 Quality | |||
| Index Inception | 12/31/1992 | 11/30/2000 | 1/31/1997 | 12/31/2001 | 12/31/1992 | 12/31/1992 | 12/31/1997 | |||
| Stats Since Indx Incptn: | ||||||||||
| Avg S&P 500 Beta | 0.86 | 1.07 | 1.00 | 0.77 | 0.74 | 0.95 | 0.92 | |||
| Annlzd Avg Resid Rtrn | 1.87% | 1.30% | 4.45% | 2.99% | 0.39% | 3.17% | 1.91% | 2.30% | ||
| Annlzd Std Dev RR | 5.45% | 5.52% | 7.11% | 5.83% | 4.37% | 8.38% | 8.05% | |||
Factor Selection and Timing
How should an investor select which factors to include in a portfolio? One approach, perhaps the most prevalent, is to look at whatever return history is available. On 12/31/2014, the available history, including pro-forma returns based on underlying indexes, would have favored the buyback ETF, which had achieved an alpha of 4.45% per year since the start of its index history in 1997. Unfortunately, that ETF’s alpha was -.24% per year after that. Conversely, the most unattractive historical alpha was for the minimum volatility ETF at only .39% per year. After 12/31/2014, this ETF was nearly tied for first place with an alpha of .25% per year.
So, using the long-term performance history of a factor ETF may not be very helpful in forecasting its future performance. (Below, we will show a small incremental benefit by using a rolling 120-month exponentially-weighted average alpha to forecast future alphas.) Is there a better way?
Fortunately, yes. It is well-known that a momentum effect seems to universally affect all financial assets, including individual stocks. Note from the table above that the momentum ETF was the best performing of the 7 during the “live” period. So, is the conclusion just to invest in that one ETF?
MTUM might well deserve a place in most portfolios most of the time, but my own research on factor momentum has recently been confirmed with the publication of an NBER paper entitled Factor Momentum and the Momentum Factor. The two finance professors who wrote the paper tested many of the most popular factor anomalies in the U.S. and international stock markets. Their findings are summarized in this abstract:
"Momentum in individual stock returns emanates from momentum in factor returns. Most factors are positively autocorrelated: the average factor earns a monthly return of 2 basis points following a year of losses and 52 basis points following a positive year. Factor momentum explains all forms of individual stock momentum. Stock momentum strategies indirectly time factors: they profit when the factors remain autocorrelated, and crash when these autocorrelations break down. Our key result is that momentum is not a distinct risk factor; it aggregates the autocorrelations found in all other factors."
In other words, what shows up as momentum in individual stocks is really momentum in the factors driving those stocks. Once factor momentum has been incorporated, individual stock momentum becomes statistically insignificant.
The paper’s authors use the usual 12-month trailing return to define momentum. I use a slightly different definition of momentum, although it is still based on the previous 12 months of returns. The difference is that I exponentially weight the months so that the most recent months get more weight than the months further back. One of my ironclad principles is that an average over time should always be based on exponential weighting. That way, the analysis is not as sensitive to the oldest observation dropping off. It is a more robust time-series method than equal weighting.
The graph below compares three different weighting methods applied to the 7 Factor ETF portfolio. The first method (blue line) is equal weighting. We have already seen that the average residual return for the “live” period was close to zero. The second method (orange line) weights each of the seven according to its relative trailing exponentially-weighted 10-year alpha, with the constraint that no single ETF may be more than 1/3 of the portfolio. The third method (green line) weights each ETF according to its relative trailing exponentially-weighted 12-month alpha, again with a 1/3 cap.
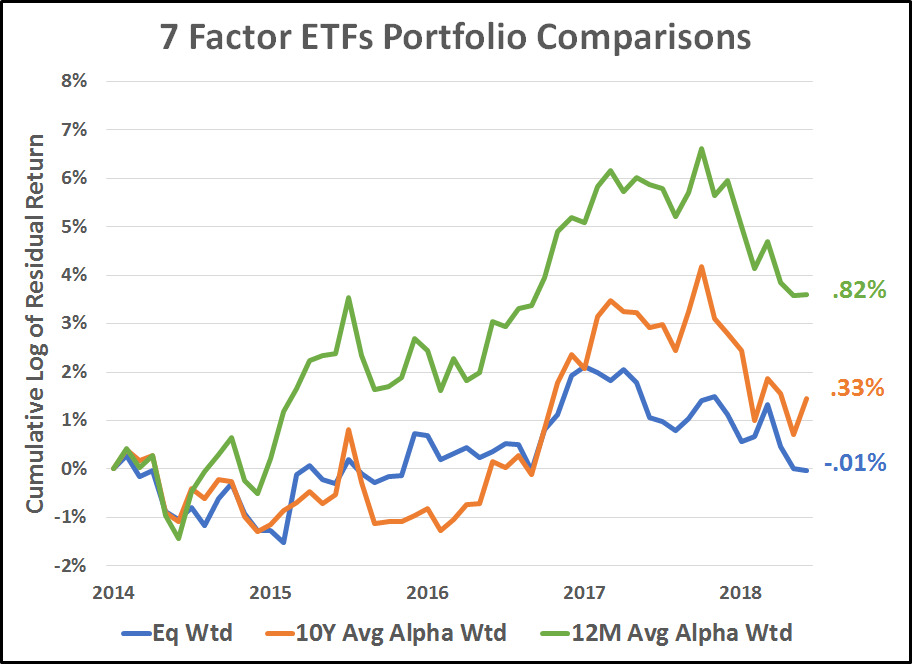
The results are modest but realistic. Compared to a -.01% annualized alpha with an equal-weighted investment in all seven factor ETFs, the second method of weighting by the trailing 10-year average alpha resulted in an average “live” alpha of .33% per year. Best of all, the third method of weighting by the trailing 12-month alpha netted an average “live” alpha of .82% per year.
Summary and Conclusions
- The potential alpha from smart ETFs is modest: 0% to 1% is realistic
- Use only smart beta ETFs that are large, liquid, and cheap—high expenses can negate the alpha
- Long-term average alphas are only marginally helpful at best at forecasting future alphas
- Twelve-month momentum is somewhat more helpful in picking near-term winners