
Should I Invest in a Global Macro Fund?
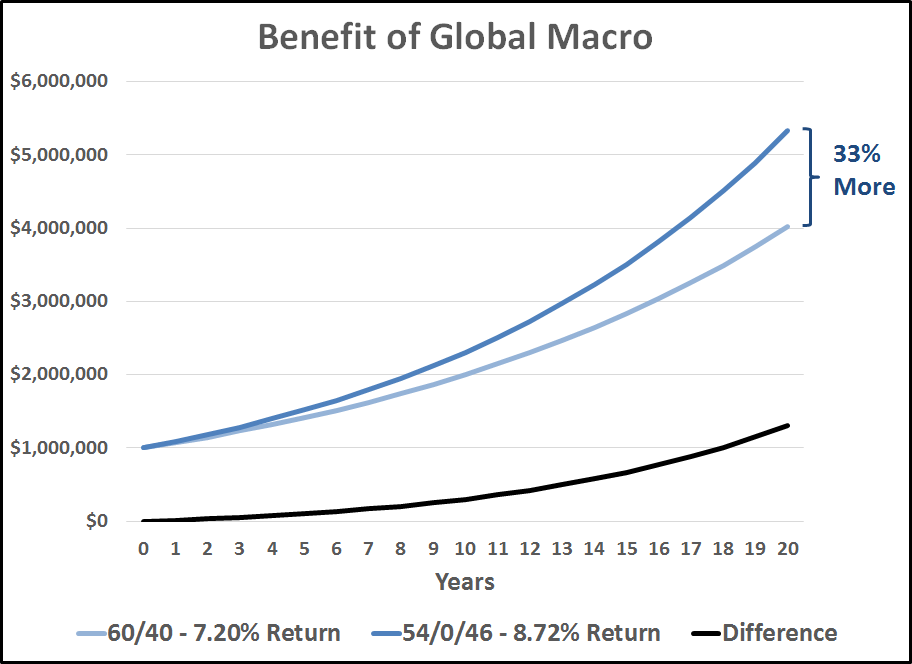
Harry Markowitz, the founding father of modern portfolio theory and winner of the 1990 Nobel Prize in Economics, is famous for describing diversification as “the only free lunch in finance.” However, it’s difficult to find real-world assets that do a good job of diversifying basic stock and bond risks and still provide an attractive level of return. Global macro funds seem to offer at least the potential to fit the bill. This article graphically illustrates the potential benefit of adding a global macro fund to a typical 60/40 stock/bond portfolio: an ending wealth level that is 33% higher after 20 years with no increase in risk (volatility).
The 60/40 Base Case Portfolio
The objective of this article is to analyze the incremental benefit of adding a global macro allocation to a typical 60/40 portfolio of stocks and bonds. To simplify the analysis, I will assume that the 60/40 portfolio contains only U.S. stocks and bonds. Adding an international component is not likely to alter the analysis by much, since international stocks are highly correlated to U.S. stocks. Also, rather than tie the analysis to a particular historical time period, I will base the analysis on reasonable projections of future risks and returns.
Let’s start with the 60/40 “base case” portfolio. To calculate the expected return and risk of the 60/40 portfolio, we need three sets of inputs:
- Expected returns for stocks and bonds
- Expected volatility for stocks and bonds
- Expected correlation between stocks and bonds
Return. Let’s use round numbers and assume that stocks will return 10% and bonds 3%. The stock return forecast is not far from the Ibbotson SBBI Yearbook data that shows an annual compound average return of 10.2% for large cap stocks since 1926. The current yield-to-maturity for the Bloomberg Barclays Aggregate Bond Index is somewhat under 3%, but we’ll round it up to 3%. Because the return forecast for any combination of two assets is simply the weighted average of the returns of the two assets, a 60/40 portfolio would therefore have a return forecast of 7.2% (60% x 10% + 40% x 3%).
Asset Return Forecast
S&P 500 10.0%
Barclays Agg 3.0%
60/40 7.2%
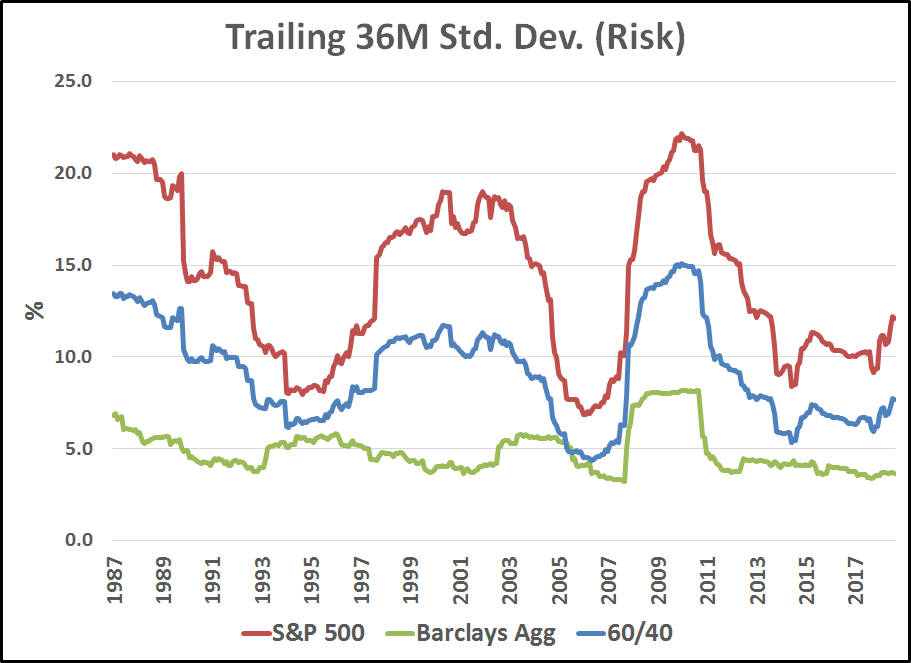
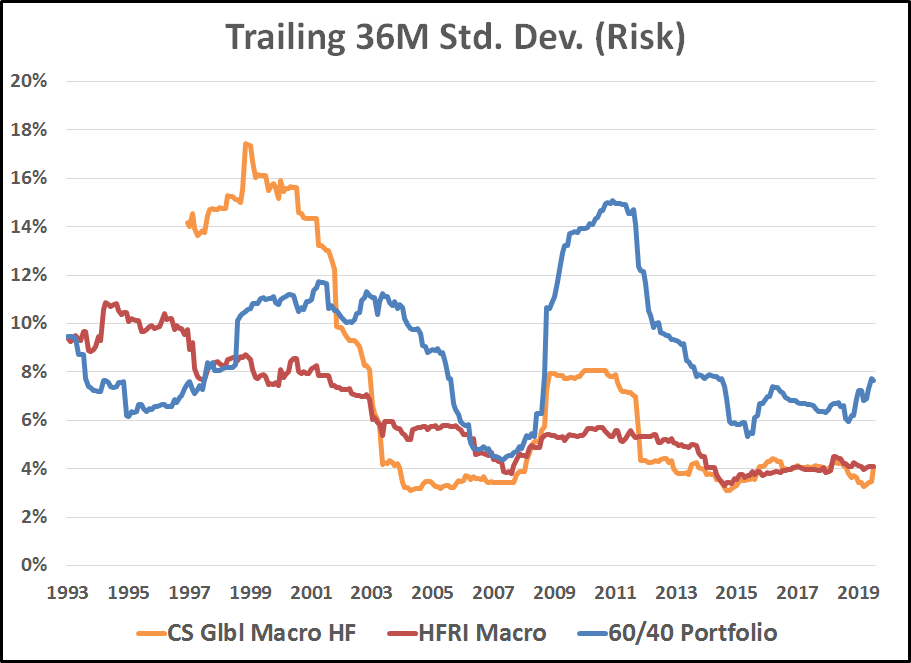
Volatility. The graph below shows the trailing 36-month volatilities for the S&P 500, the Barclays Agg, and a 60/40 portfolio. As of July 31, 2019, the most recent 36-month volatilities were as follows:
Asset 36M Volatility Volatility Forecast
S&P 500 12.09% 12.0%
Barclays Agg 3.67% 3.5%
60/40 7.66%
Unlike return, the volatility forecast for any combination of two assets is not simply the weighted average of the volatilities of the two assets. The correlation of between the two assets also affects the volatility.1 Given the volatility forecasts for stocks and bonds of 12% and 3.5%, respectively, the lower the correlation between stocks and bonds, the lower the volatility of the 60/40 portfolio:
Correlation 60/40 Volatility
100% 8.60%
50% 7.99%
0% 7.33%
-50% 6.61%
-100% 5.80%
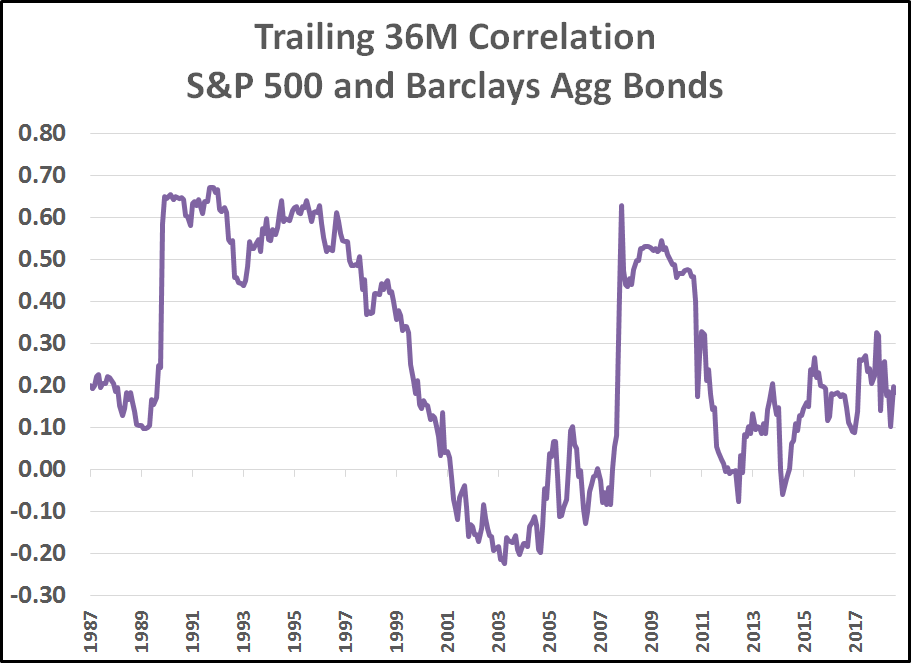
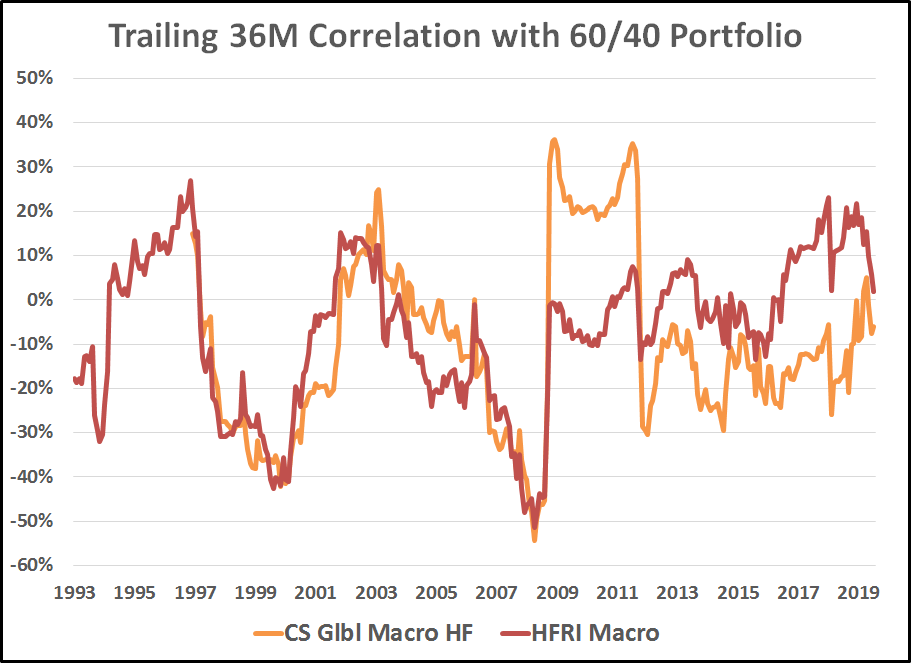
Correlation. The graph below shows the trailing 36-month correlation between the S&P 500 and the Barclays Agg. As of July 31, 2019, the most recent 36-month correlation was .18. Because it has recently been close to zero and because the math is simpler, we will assume a zero correlation. This means that the 60/40 portfolio will have a volatility forecast of 7.33%.
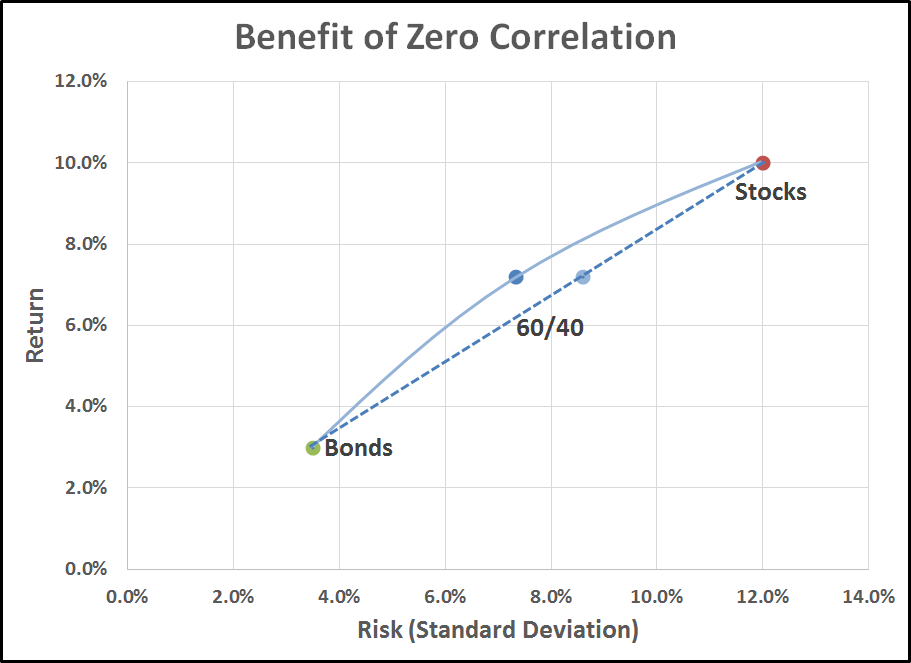
The graph below shows the return/risk relationship for stocks, bonds, and the 60/40 portfolio, given the assumptions above. Note that the zero correlation causes a slight concave “bend” in the solid return/risk line connecting stocks and bonds with the 60/40 portfolio. A correlation of 100% (no diversification benefit) would have resulted in the dashed straight line between stocks and bonds. The return is the same, but instead of a volatility of 7.33%, it is 8.60%.2
Addition of an Uncorrelated Asset: Global Macro
Now, we will introduce another asset, a global macro fund, which we will assume has the following characteristics:
- Same return as the 60/40 portfolio
- Same volatility as the 60/40 portfolio
- Zero correlation with the 60/40 portfolio
Are these in fact reasonable assumptions for a global macro?
Global macro funds usually have portfolios that include long and short positions in various equity, fixed income, currency, commodities, and futures markets. The hedged nature of their holdings tends to result in a low correlation with stocks and bonds. Their volatility may be high or low depending upon the amount of leverage employed and the extent to which derivatives are utilized.
FactSet provides historical returns for both the Credit Suisse Global Macro Hedge Fund Index and the HFRI Global Macro Hedge Fund Index. These two indexes provide us with an opportunity for a “real world” validation or rejection of our assumptions. (Global macro funds are available as hedge funds, mutual funds, or separately managed accounts. Hedge fund data is the most readily available.)
Our first assumption is that the global macro fund will have the same return as the 60/40 portfolio. Here are actual historical returns for longest overlapping time periods we have (starting February 1994):
CS Global Macro 9.44%
HFRI Global Macro 6.25%
Avg. Global Macro 7.84%
60/40 Portfolio 7.29%
So, it appears reasonable to assume that the global macro fund could have about the same return as the 60/40 portfolio over the long run.
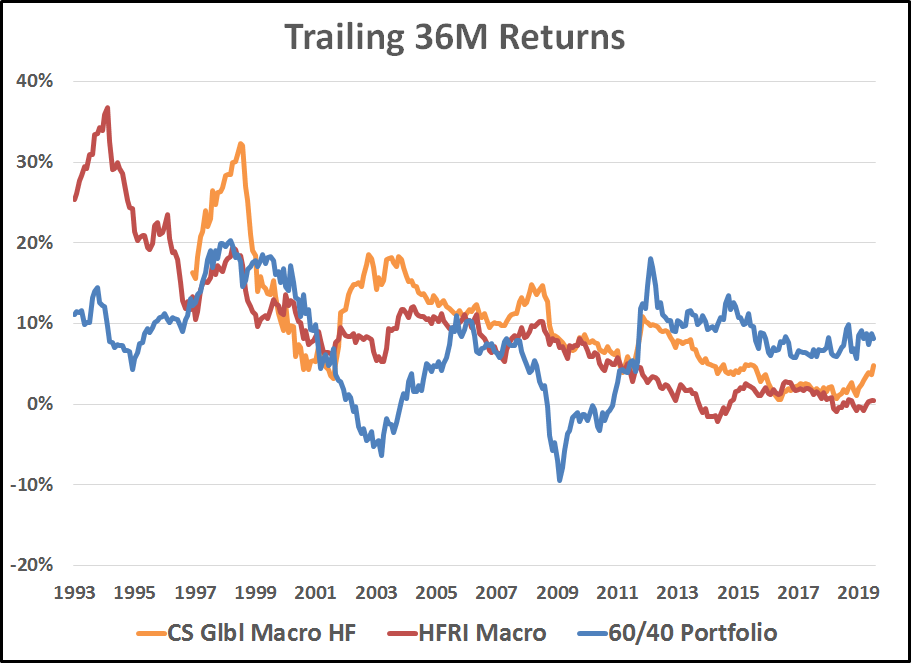
The graph below compares the historical trailing 36-month returns of the two global macro indexes to the 60/40 portfolio. Clearly, global macro fund returns have not tracked the 60/40 portfolio’s returns very closely. However, since one of the basic functions of a global macro fund is to diversify stocks and bonds, that would seem to inherently require returns that are quite different, at least in the short run.
Our second assumption is that the global macro fund will have the same volatility as the 60/40 portfolio. The graph below compares the historical volatility of the two global macro indexes to the 60/40 portfolio. On the surface it appears likely that the global macro fund will have a significantly lower volatility than the 60/40 portfolio. However, it is true that often the volatility of an index of funds will be significantly lower than the average volatility of the individual funds that comprise the index. There is a lot of volatility-minimizing cancellation that goes on each month when the returns of the individual funds are averaged to construct the index. So perhaps the assumption is not inaccurate with respect to the volatility of a typical global macro fund.
Our third and final assumption is that the global macro fund will have a zero correlation to the 60/40 portfolio. The graph below shows the historical correlation of the two global macro indexes to the 60/40 portfolio. It appears reasonable to assume a zero correlation. The long-term average has been about -10%, but more recently it has been closer to zero.
The Diversification Payoff: Lower Risk and/or Higher Return
Adding an asset that has a zero correlation with your existing portfolio will greatly reduce its volatility. In the graph below, we start with the original 60/40 portfolio, which is the light blue dot. For every 10% allocation moved over to the global macro fund, the return/risk dot moves to the left. The expected return doesn’t change because we have assumed that the return of the global macro fund and the return of the 60/40 portfolio are the same.
The lowest risk combination is a 50/50 blend of the 60/40 portfolio and the global macro fund, depicted with the leftmost blue dot. If risk reduction is our objective we could stop there. We have lowered the expected volatility from 7.33% to 5.18%. Job well done.
However, if we were happy with the original risk level of the 60/40 portfolio, now we are able to move up the new, higher, levels of return at the same level of risk (7.33%) by keeping the allocation to stocks relatively high and substituting global macro for bonds.
A moderate approach would be to substitute half of the 40% bond allocation with global macro. The new asset mix (rounded a bit)3 would be 60% in stocks, 20% in bonds, and 20% in global macro, and is depicted with a dark blue dot below. This results in a return of 8.02% (compared to the 60/40 return of 7.20%), and the same level of risk (7.33%). That’s an additional 0.82% in return each year.
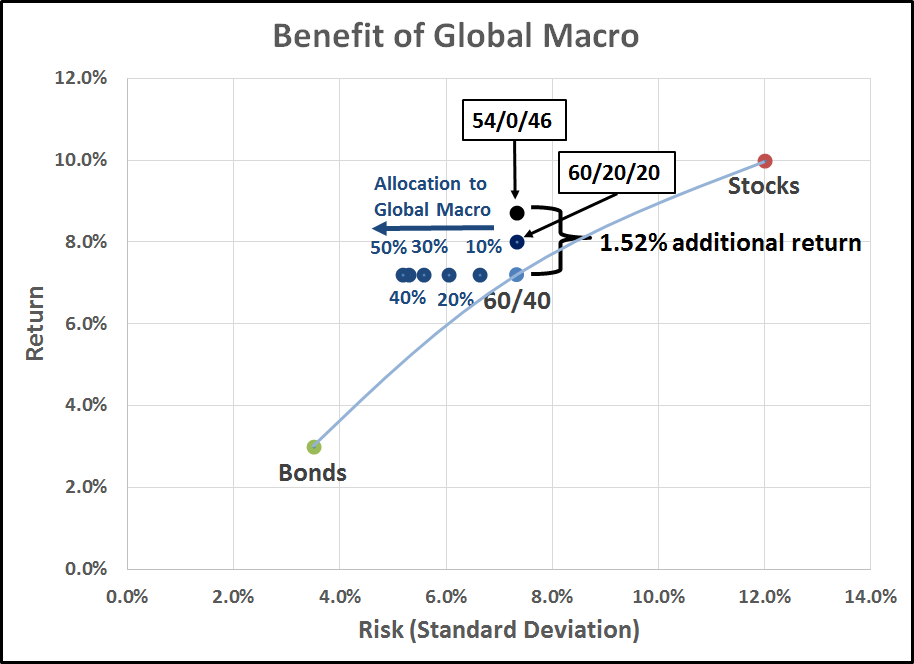
The highest return asset mix that still maintains a 7.33% level of risk would be to eliminate bonds entirely. The asset mix would be 54% stocks and 46% global macro, and is depicted with a black dot above. The resulting expected return is 8.72% (compared to the 60/40 return of 7.20%). That’s an additional 1.52% in return each year.
How much difference does an additional 1.52% make? Quite a lot, actually, if allowed to compound over the long-term. As shown in the graph below, a $1 million investment in the original 60/40 portfolio with a return of 7.20% would grow to just over $4 million after 20 years. However, the enhanced 54/46 portfolio with a return of 8.72% would grow to over $5.4 million—an additional $1.3 million. That’s 33% more money.
Endnotes:
1For the mathematically inclined, the formula for calculating portfolio return is simply the percentage weight of each asset multiplied by its expected return. The formula for calculating portfolio standard deviation (in Excel) with two assets (S and B) is as follows:
SQRT((WtB^2*SDB^2)+(WtS^2*SDS^2)+2*(WtB*SDB*WtS*SDS*CorrelSB))
Where,
WtB = % weight of asset B
SDB = standard deviation of asset B
WtS = % weight of asset S
SDS = standard deviation of asset S
CorrelSB = correlation of assets S and B
2At a 100% correlation, the volatility forecast is simply the percentage weight of each asset multiplied by its volatility.
3The precise asset mix to achieve a volatility of exactly 7.33% is 59.5% in stocks, and 20.25% each in bonds and global macro.