
Should I Invest in Individual Sectors and Industries?
The presence of many sector and industry ETFs makes industry-targeted investing convenient and inexpensive. It can also be profitable. This article will highlight several characteristics that have provided consistent risk-adjusted excess return, including value-, momentum-, quality-, and sentiment-related factors.
The Sector and Industry ETFs Universe
Before presenting the results of our research, I should describe the universe of sector and industry ETFs that we at Sapient Investments use for both research and investment. We do not include each and every sector and industry ETF. We are sensitive to transaction costs, so in those cases where there is more than one ETF within a sector or universe, we use the most liquid one as measured by the average bid-ask spread. We also give some consideration to the expense ratio and the total assets if there is a close call.

As shown in the graph above, at the end 1999, there were only the nine SPDR sector ETFs in our Sector and Industry universe. The number shot up to 43 by the end of 2006. Currently, the count is 79, which gives us a very diverse opportunity set. This universe is also very investable, with an average bid-ask spread of only .09% and an average expense ratio of .43%. While this is expense level is higher than that of most broad, capitalization-weighted index funds, expense ratios are coming down. The 11 SPDR sector funds, all priced at .13%, are extremely liquid (.01% bid-ask spreads) and are therefore the most frequently used ETFs in our universe.
Sector and Industry Selection Factors
The same factors (characteristics or attributes) that published academic research has found to be helpful in selecting individual stocks can be helpful in selecting sectors and industries. These factors can be grouped into the following categories:
- Value
- Momentum
- Quality
- Sentiment
In this article we will focus on one factor in each category for illustrative purposes. In our live investment process, we tend to use 2-4 separate factors within each category.
Value: EBIT/EV
EBIT is earnings before interest and taxes (EBIT). It is divided by enterprise value (EV), which includes the market value of equity and the book value of debt. This value ratio is one that a private equity investor looking to purchase the whole company might use.

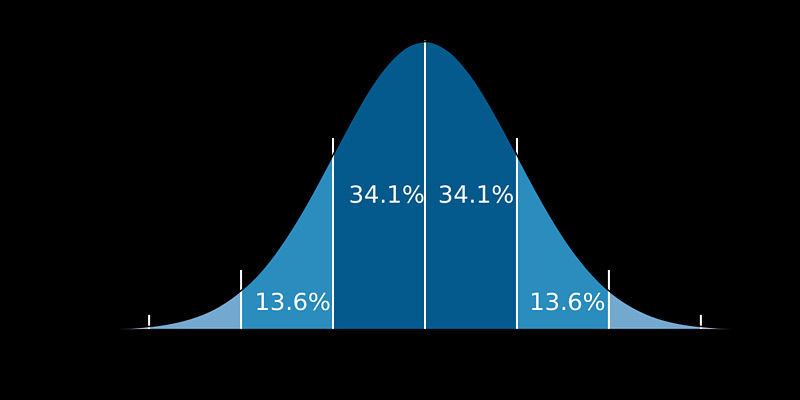
The graph above is a “factor graph.” It shows the cumulative return from a portfolio that is neutral in all respects but has a one standard deviation above average exposure to the factor. The graph below, from Wikipedia, illustrates the standard normal distribution. The line labeled “1σ” is for 1 “sigma” the Greek letter usually used for one standard deviation. Note that in terms of percentile, a one standard deviation factor exposure is higher than 84.1% of the observations—only 15.9% are above it.
The cumulative return graph above showed a cumulative return of about 34% since 2008, which equates to about 3.0% per year. 3.0% does not appear very impressive on the surface. However, note that it is not cumulative total return that is being measured but the log of cumulative residual return. The distinction is vital. The vast majority of return for sector and industry ETFs is systematic return, most especially return derived from an ETF’s market beta or sensitivity to the market. Residual return is the return that is left unexplained by an ETF’s systematic risk factor sensitivities. Over the long-term, the average residual return for all of the ETFs in the universe is zero! That’s right. There is no alpha. Overall, on average, over the long term, ETFs earn return only from their systematic risk sensitivities, especially their sensitivity to the market (or market beta).
However, that is the average. Some ETFs have had a positive residual return, and some a negative residual return. What we would like to know is, are there characteristics that have consistently been associated with positive residual return? EBIT/EV is one. Sectors and industries that are cheap, with higher EBIT/EV, have provided positive residual return over the long-term, but with significant volatility.
Momentum: 12-Month Exp Wtd Residual Return
Most published work on momentum uses return over the prior twelve months as the basis for the calculation. When defining momentum for individual stocks, the last month is omitted because of the strong tendency for stocks to experience short-term reversal. However, when dealing with sectors and industries, the last month is typically included because there is no evidence of short-term reversal, and indeed, there is evidence of month-to-month serial correlation.
Returns for various trailing time periods may be used to capture momentum effects—1,3,6,9,12 and even 36 months have all been used, although 12-month trailing return is by far the most common. At Sapient Investments, our preferred methodology is to use the exponentially-weighted 12-month moving average (shown below), rather than an equal-weighted 12-month moving average.

The other important twist that we apply to measuring ETF return momentum is to use residual returns rather than total returns as the basis for the factor. Since we are attempting to forecast residual returns, it makes sense to use trailing residual return to build our factor.

The factor graph for 12-month exp. wtd. residual return (above) shows an annualized average “pure factor” residual return of 3.7% per year. Again, what is being depicted is the cumulative log of residual return to a portfolio that is neutral in all respects but has a one standard deviation positive exposure to the factor.
It would be ideal if we could find some ETFs that have significant positive exposures to both the EBIT/EV factor, which had an average annualized residual return of 3.0% per year, and this momentum factor with its 3.7% average payoff. However, that is not likely because value and momentum are seldom both found in the same securities. That’s the bad news. The good news is that their payoffs tend to diversify each other very well, so having some exposure to both is still very attractive to the extent that you can find it. In practice, we generally have to settle for ETFs that have modestly favorable factor exposures to one or more of the factors and avoid strongly unattractive exposures to any of them.
Quality: ROIC
Return on invested capital (ROIC) is a measure of how profitable a company is. ROIC is net income divided by invested capital, which consists of the book value of both debt and equity. It differs from ROE (return on equity) in that both debt and equity are included in the denominator, so a company that uses debt instead of equity as a source of capital is not rewarded.

ROIC is indeed a powerful factor, returning an average of 5.3% per year since 2008 as shown in the factor graph above. Technology stocks tend to have the highest ROIC consistently. Traditional and alternative energy stocks currently have the lowest ROIC.
Sentiment: EPS Estimate Revision Diffusion
The changes that analysts make in their forecast of future EPS has been shown to be a powerful predictor of future relative performance for stocks for many years. “Diffusion” is calculated as (#up - #down) / (#up + #down), which is a way of calculating %up-%down. “# up” means the number of upward analyst revisions of EPS in the last month. At Sapient Investments, we use a fairly complex way of incorporating changes in the EPS forecasts that analysts make for the underlying constituents of an ETF, combining data for the next two fiscal years.

Because it is based on changes in the estimates for future earnings, EPS estimate revision diffusion tends to be the most forward-looking factor, providing an early warning if the outlook for a sector or industry is changing. It has had a fairly consistent annualized average residual return of 3.8% with few significant drawdowns.
Conclusion
It is certainly possible to add noticeable value by investing in individual sector and industry ETFs. We examined four different factors that could be used for that purpose. ETFs with high exposures to these factors would have added about 3%-5% per year in residual return (net of risk effects such as sensitivity to the market). Combining exposures to many different kinds of factors with low correlations to each other should help lower the volatility of the residual return. Even with a generous level of transaction costs (bid-ask spread and commission), this level of return is economically significant.