
What Should I Do with My Cash?
It Matters Now
Until just a few months ago, it really didn’t matter much how or where you invested your cash balances: banks, brokerage sweep accounts, and money market funds were all offering extremely low yields.
No more.

The yield environment has changed dramatically over the past year. Now it really matters what you do with your cash balances. Over the course of 2022, the Fed funds rate, which tends to drive most short-term yields, has vaulted from .08% to 4.33%.
Avoid Banks
According to the FDIC, the average rate paid on interest checking accounts is .06%! And the rate for savings accounts is not much better, at just .33%. And yet, as a recent article in The Wall Street Journal pointed out, most people are not paying attention. They are just leaving their money in bank accounts that pay a paltry rate of interest.
Avoid (Most) Brokers’ Sweep Accounts
Several years ago, most brokerage firms stopped allowing customers to sweep their idle cash into a money market fund. Instead, nearly all of them are sweeping cash into a bank account. Often, the bank is an affiliate of the broker, or else it pays the broker for the flow of cash. An article in Barron’s pointed out, for example, that “Schwab makes most of its money off interest income from reinvesting customer cash and other assets.” Nearly all brokers earn enormous profits from their customers’ cash balances.
Brokers are certainly not paying competitive rates on cash balances. The Crane Brokerage Sweep Index, an average of the 11 largest brokerage firms' "sweep" rates, is currently showing a rate of 0.26% for balances of $100K to under $250K. (It is lower for smaller balances.)
Interactive Brokers, our custodian here at Sapient Investments, far outshines its competitors in terms of interest rates paid on uninvested cash balances. As one reviewer puts it, “While Interactive Brokers may not be a household name, their interest offerings on idle cash are the best in the industry.” IB’s current rate on cash balances over $10,000 is 3.83%.
Avoid Illiquidity (CDs)
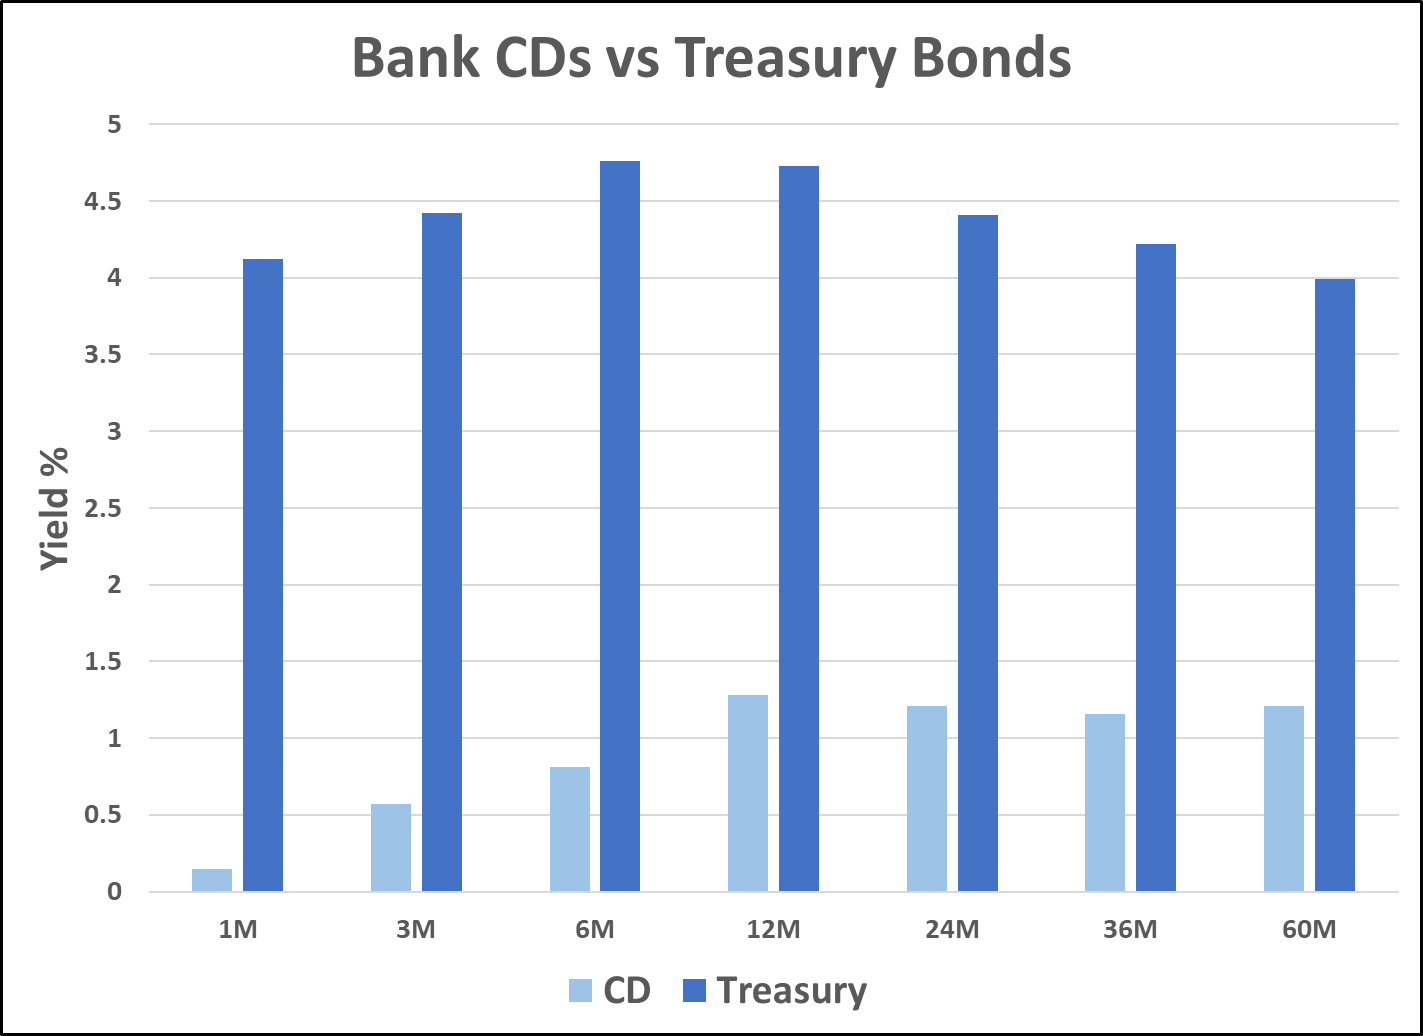
Even if you are willing to lock you money up for a period of time in a bank CD, the interest rate you will get will be far behind a market rate. The graph below compares average bank CD rates form the FDIC database with Treasury instruments of the same maturity. Quite a difference!
Like brokerage firms, banks count on the inertia of their customers for much of their profits. Don’t let banks earn interest on your money that should rightfully be yours!
Besides, tying up your money in bank CDs during a rising interest rate environment could mean that you lose out on the opportunity to redeploy your money into investments with higher yields down the road.
Best Yield Curve Spot
The graph above shows that the peak of the Treasury yield curve is around six months to one year. However, the bar graph does not show the incremental risk undertaken by extending maturity out beyond the one month to three months.
The graph below shows the yield/duration tradeoff for Treasury instruments as of December 31, 2022. The additional interest rate risk for climbing up the short end of the yield curve is minimal--you collect a lot of incremental yield for not much incremental duration. This is typical for the short end of the curve. Money market funds are quite popular and have enormous assets. They promise their investors that they will not lose money—not “break the buck.” To avoid that risk, they must keep their duration (the measure of interest rate risk) near zero. That means by necessity their investments must be concentrated on the very short end of the yield curve. This fact tends to systematically drive up the prices of instruments with a near zero duration, driving down their yield.

The duration of the six-month point on the curve is always just below .5, and the duration of the one-year point on the curve is always just below 1.0. The duration of the one-month point is always about .08. The increased duration from one-month to six-months is about .40. Duration measures the price change for a 1% change in interest rates. At a duration difference of .40, if interest rates increase by 1% over the next six months, the six-month Treasury would underperform the one-month Treasury by .40% (.40 x 1%).
However, the “yield pickup” for extending from one month to six months is about .75%. Thus, interest rates would have to increase by almost 2% for the six-month Treasury to underperform the one-month Treasury. Even the most hawkish Fed members are not supporting that kind of increase that quickly.
Because corporate bonds are priced off of the Treasury yield curve, the optimal point on the Treasury bond curve is likely to also be the optimal point on the corporate bond curve. Based on the prices on December 31, 2022, it appears that the optimal point is at a maturity of around six months to one year. This is within the “ultra-short” category of funds that have a very low duration but are not quite money market funds. Maintaining an ultra-short duration could also provide important protection from further increases in interest rates.
Best Ultra-Short Funds
The table below lists six representative ultra-short bond funds. Exchange-traded funds (ETFs) are my preferred fund type because they can be simultaneously bought and sold, allowing for smoother portfolio rebalancing. Mutual funds require settlement of the selling trade before the funds are available to make the purchasing trade. However, despite the inconvenience of using mutual funds, I wanted to include money market funds for comparison purposes. There are no U.S. money market ETFs. Money market funds have a stable price, but ETFs are required to fluctuate in price with fluctuations of their underlying portfolios. Even ultra-short ETFs will fluctuate a little bit.
The two money market funds listed below are Fidelity funds. I selected them because they are very large, have zero minimums (like ETFs), and illustrate the difference between government money market funds and prime money market funds. Government money market funds invest in U.S. Treasury and Agency instruments. Prime money market funds invest in those as well as corporate commercial paper, bank CDs, and other short-term instruments. The SEC yields for the two money market funds are taken from the Fidelity website, and are as of December 31, 2022. Money market funds are generally considered to have a zero duration.
The other four funds are all exchange-traded funds (ETFs) issued by Blackrock, which is perhaps the most competitive bond fund ETF issuer in terms of both expense ratios and bid-ask spreads. All of the ETFs are extremely large, liquid, and cheap. Because they are all issued by Blackrock, the SEC yields and duration statistics should be comparable. (That may not always be the case when comparing one issuer to another.) The SEC yield and duration figures are as of January 24, 2023.
Selected Ultra-Short Bond Funds | ||||||||
| Ticker | Name | Exp. Ratio | Bid-Ask Spread | Category | Duration | SEC Yld | ||
| SPAXX | Fidelity Hereford Street Trust Spartan US Government Money Market Fund | 42 | #N/A | Government MM | 0.00 | 3.85% | ||
| SPRXX | Fidelity Hereford Street Trust Spartan Money Market Fund | 42 | #N/A | Prime MM | 0.00 | 4.14% | ||
| SGOV | iShares 0-3 Month Treasury Bond ETF | 5 | 0.02% | Treasury | 0.09 | 4.13% | ||
| SHV | iShares Short Treasury Bond ETF | 15 | 0.01% | Treasury | 0.33 | 4.30% | ||
| FLOT | iShares Floating Rate Bond ETF | 15 | 0.02% | Corporate | 0.05 | 5.06% | ||
| ICSH | iShares Ultra Short-Term Bond ETF | 8 | 0.02% | Corporate | 0.43 | 4.43% | ||
“SEC yield” is the preferred method of comparing yields among fixed income funds. The 30-day SEC yield reflects the interest earned on the fund portfolio for the most recent 30-day period after subtracting fund expenses. “Duration” is effective duration, which measures sensitivity of price to interest rate changes, and accounts for any embedded bond optionality (call risk).
There are two primary types of bond risk: 1) interest rate risk and 2) credit risk. Duration measures interest rate risk. Treasury instruments are generally assumed to have no credit risk. The prime money market fund has minimal credit risk in that about half of the portfolio consists of Treasury and Agency instruments, and the balance of the portfolio consists of high-quality credits. The two corporate ETFs do not invest in Treasury bonds, only corporate bonds. The weighted average credit rating for both corporate bond funds is A+.

SPAXX, SGOV and SHV (green dots--government) all have lower yield/duration tradeoffs compared to SPRXX, FLOT and ICSH (blue dots--corporate). This is as expected. A significant percentage of investors are either compelled to invest only in government bonds by statute, or else prefer the perceived safety of a 100% government investment. This “clientele effect” tends to push up the prices of government securities, and push down their yields.
Both FLOT and ICSH are corporate bond funds that have some credit risk in their portfolios. Although the Blackrock fact sheets for both funds indicate that they both have a weighted average rating of A+ for their underlying portfolios, the historical return behavior of FLOT indicates that it has significantly higher credit risk than ICSH. One way of measuring credit risk is with stock market beta. Because corporate bonds share some of the same sensitivities to credit spreads, economic cycles, and market risk preferences, a bond fund with a higher stock market beta may be reasonably assumed to have higher credit risk. The Sapient Investments’ proprietary risk model indicates that FLOT has a MKT beta of about 5%, whereas ICSH has a MKT beta of about 1%. This indicates that, empirically, FLOT has more credit risk, which is reflected in its higher yield.
Recommended ETF: iShares Ultra Short-Term Bond ETF (ICSH)
Because it is attractive from both a yield/duration risk and because of its lower credit risk compared to FLOT, I recommend ICSH as an attractive investment option for your cash. Its current 30-day SEC yield of 4.43% barely edges out SHV’s yield of 4.30%, but ICSH’s yield-to-maturity is 4.78%. I expect its future yield to approach that level, which would be more in keeping with the steep slope in the yield curve at the short end.
One of the keys to its success is its very low expense ratio: 8 basis points. This gives the fund a consistent advantage relative to more expensive competitors.
Another attractive feature of ICSH is the fact that it is actively managed. An index fund is tied to its underlying index holdings and will tend to buy a representative slice of the index portfolio regardless of credit quality. In fact, the more bonds a corporation issues, the worse its credit, but the larger its weight in the index. An actively managed bond fund has the flexibility to under-weight, or even avoid, weak credits within its universe of issuers. This is one possible concern with respect to corporate bond index fund ETFs such as FLOT. And with an expense ratio of only 8 basis points, investors are not having to pay much for the benefit of active management.
Summary and Conclusions
- Market yields are much higher, so it now makes sense to pay close attention to where you invest your cash.
- Avoid bank checking and savings accounts, which still pay an average of only .06% and .33%, respectively.
- Avoid brokerage sweep accounts, which pay an average of only .26% (except Interactive Brokers, which pays 3.83%).
- Avoid bank CDs because their yields are much lower than Treasury yields with equivalent maturities.
- In addition, bank CDs are illiquid, which could be a significant disadvantage in a rising interest rate environment—you might lose the opportunity to reinvest later at higher yields.
- The yield/duration sweet spot on the Treasury yield curve is at the six-month to one-year maturity range.
- This “ultra-short” maturity range has a low level of interest rate risk (duration), which will provide protection if interest rates continue to increase.
- Top fund recommendation: iShares Ultra Short-Term Bond ETF (ICSH).