
Your Spending Policy in Retirement
You’ve spent years diligently saving and planning for retirement. But when the time finally comes to retire, do you know how much you can safely spend each year? If you are unsure of the answer you’re not alone. While there are “rules of thumb” like the 4 percent rule, arriving at the best spending policy requires some thought. This article will help you decide what is right for you.
The Goal: A Stable and Safe Standard of Living
Ideally, you probably want to have a fairly steady living standard throughout your retirement years. This does not necessarily mean that your spending will be the same every year. It is common for retirees to spend more in the early years when they are more active with travel and other recreational activities. In later years, spending on health care will increase and can vary greatly.
The most important thing is that spending be at a “safe” level, that is, at a level unlikely to lead to unwanted dramatic cutbacks later in life. Nobody wants to be saying “would you like fries with that?” in their 70s.
The Fear: Running Out of Money
According to recent research, the single most frequently cited retirement fear is “outliving my savings/investments” (48 percent). Yes, Social Security provides a very basic safety net that will keep you out of abject poverty, but most people aspire to a retirement lifestyle that is quite a bit better than Social Security will provide. (Social Security is an important part of retirement income for most, and smart benefits claiming strategies can make a significant difference.)
A realistic spending plan can help make sure that you don’t overspend in the early years and have to make painful reductions in your standard of living later on. But what is realistic? What is “safe?”
The Old (Wrong) Way: Spend Income Not Principal
It is unfortunate that some people still have the impression that they should only spend whatever “income” is generated by their retirement portfolio, and that if they do so , their “principal” will be safe and they will never run out of money. This fallacy is based on a very old (and outdated) legal principle which only allowed the spending of dividends and interest income and never capital gains. Of course, it is and always was possible to increase the amount of income by specifically investing in assets with higher yield, but these are usually riskier assets that are more likely to experience capital losses.
For decades (since at least the early 1970s), the investing community has used a “total return” approach to managing portfolios. This recognizes that money is “fungible,” and that dollars from interest, dividends, and capital gains are perfectly interchangeable. As far as establishing a prudent spending policy, what matters is the rate of spending relative to the value of the portfolio, not the source of the spending.
With interest rates at historic lows, for many retirees it would not be realistic to spend only dividends and interest. Most of the long-term return of a balanced portfolio of stocks and bonds will come from capital gains on the amount allocated to stocks. In fact, it probably safer and more prudent to have a well-diversified portfolio of stocks than an “income-oriented” stock portfolio selected on the basis of yield enhancement driven by the fallacy spending only “income.”
The 4% Rule of Thumb
The “4 percent rule” became a standard retirement strategy after William Bengen, a financial advisor, published a study in 1994 suggesting that 4% was a safe spending level with a 50%-75% stock allocation in a balanced portfolio. Bengen's research used historical stock market data from 1926 to 1976 and concluded that regardless of how markets performed, taking out 4 percent from a balanced investment portfolio did not wholly deplete available funds for at least 33 years, longer than the typical retirement at that time. Since the data range Bengen chose included two severe market downturns, it is generally believed this withdrawal methodology is safe.
To implement the 4% rule, a newly retired person would calculate a spending budget equal to 4% of their portfolio when they retire. They would then (usually upwardly) adjust that budget each year by the amount of annual inflation that occurred over the past year.
Under the 4% rule, spending is completely independent of investment performance. It is important to keep the stock allocation within the 50%-75% collar, but it is assumed that no cuts in spending are ever required under this plan.
The 4% Rule Updated
There are several problems with the 4% rule of thumb, but I will focus on most serious one. First and foremost, it implicitly assumes that future stock and bond returns will be like they were from 1926 to 1976. They won’t. Most importantly and most assuredly, long-term returns from this point forward will be decidedly lower than they were for Bengen’s study period.
Financial assets are subject to a lot of return variability, which can mask the fact that their expected returns (the mid-point of a distribution of possible future returns) may be best estimated from current prices and fundamentals, not from an average of past returns. This is particularly obvious in the case of bonds. Forecasting the expected return for bonds is very straightforward. A bond is a loan with specified repayment terms. Held to maturity, unless the seller defaults, the return is the yield-to-maturity (YTM), which takes into account the current price, the interest coupons, and the principal repayment at maturity. Thus, the expected return for any bond is its current yield-to-maturity. End of story.
Since 1926, the compound average return of intermediate government bonds (approximated with the 10-Year Treasury Bond) was about 5.1%. The current yield on the 10-Year Treasury is 0.7%. It would be ludicrous to assume an expected return on intermediate government bonds of 5.1% given that their current yield is .7%, but this is surprisingly common practice among financial planners.
Similarly, just because U.S. stocks achieved a compound return of about 10% per year since 1926 (according to the Ibbotson database) does not mean that 10% is a reasonable forecast going forward. For one thing, both inflation and interest rates were much higher on average over that period than they are now. The average inflation since 1926 was 2.9%, so the real return on stocks (above inflation) was 7.3%. And there are very good reasons to believe that future real returns for U.S. stocks are going to be much lower.
For one thing, the U.S. experience was a fortunate outlier. The 2011 landmark study by Dimson, Marsh and Staunton (DMS) of the London Business School showed that the U.S. has had one of the world’s highest stock market returns. “This makes it dangerous to generalize from that country’s historical returns” according to DMS. Over the 111-year period studied (which is updated annually in the Credit Suisse Global Investment Returns Yearbook), the authors found that whereas the U.S. market achieved a real return (over inflation) of 6.3% per year, the average global stock market experienced a 5.5% real return.
Perhaps more importantly, DMS found that even the 5.5% average real return was well above what could have reasonably been expected at the start of that time period. They estimate that the expected equity risk premium was 3% to 3 1/2%. The primary factor that caused actual returns to be above expected returns was a large and unexpected upward revaluation of the market: the prices paid for stocks as multiples of dividends and earnings greatly expanded over this time period. This is not a repeatable event. P/Es cannot expand forever.
Updating the original 1994 Bengen study is a more recent (2013) and more thorough study by Blanchett, Finke, and Pfau (BFP), which found that “the safety of a given withdrawal strategy is significantly affected by the initial bond yield and CAPE value [cyclically adjusted price-to-earnings ratio of the stock market] at retirement.” For example, in 2013 (the publication date), when the 10-Year Treasury Bond yield was 2% and the CAPE was 22, BFP found that the risk of ruin (running out of money) for a retiree using a 4% withdrawal rate and a 40% allocation to equities over a 30 year period was approximately 50%! Even for a 60% allocation to equities, the probability of ruin was still about 40%! Once the typical 1% fee has been added to the calculations, the probability of ruin rose to about 60% for the 40% equity portfolio and 50% for the 60% equity portfolio. Even an allocation of 80% in equities did not get the probability of ruin much below 50%!
And that was using yields and CAPE ratios from 2013. The current yield on the 10-Year Treasury Bond is not 2%, it is only 0.7%. And the current CAPE ratio of the S&P 500 is not 22, it is 31! This is not a very good time to be retiring if you are counting on your investment portfolio for much of your long-term future income. If the 4% withdrawal rate was not realistic in 2013, it is certainly even less so today.
The “risk of ruin” arises from two statistical possibilities: 1) unexpectedly low average returns over the entire retirement time period, and 2) extremely high return volatility, especially large drawdowns early in the retirement time period.
The fact is that we do not know what the returns of a balanced stock and bond portfolio will be in the future. Current yields and stock market prices strongly indicate that future returns will be lower, perhaps much lower, than they were over the long-term past.
The Safest Asset: TIPS
An investor who does not want to take any risk in their portfolio would invest only in risk-free assets, which for U.S. dollar-based investors would be a portfolio of Treasury Inflation Protected Securities (TIPS). Only TIPS protect investors from both loss of principal and loss of purchasing power.
Social Security benefits are also backed by the federal government and are also indexed to inflation, so they provide the same protection, but the monthly benefit amounts are limited. You can’t “buy” more Social Security, although you can (and almost certainly should) wait until age 70 to start collecting benefits, which will maximize this very valuable part of your retirement income. But unless you have a traditional defined-benefit pension plan, the rest of your retirement income will be drawn from your investment portfolio.
Absolute safety is a wonderful thing if you can afford it, but most of us can’t. The textbook approach to absolute safety with a laddered TIPS portfolio would be to invest an amount equal to the required income for each future year in TIPS that matured in that year. However, the longest maturity TIPS that are available only extend out to 30 years, and there are a significant number of years for which no TIPS are available at all. Constructing such a portfolio would be a very complex undertaking.
And the expected returns based on current TIPS prices are not very attractive. The current yield on the 10-Year TIPS is -1.0%! That is, the bond is priced to provide a real yield of -1% over the next 10 years. This makes sense once you know that the current yield on the nominal 10-Year Treasury Bond is .7%. Essentially, the TIPS price implicitly assumes that inflation will average 1.7% over the next 10 years. The Fed recently announced that it views its long-sought target inflation rate of 2.0% as a target average rate, not a ceiling. Thus, it is signaling to the market that it will not move to raise rates unless and until inflation exceeds 2.0% for some time. This has helped to drive inflation expectations up and TIPS yields down.
Estimated Portfolio Longevity
Although both the average level and the path of returns matter during retirement, between the two what matters more is the long-term real average return of your portfolio. Higher real rates of return mean that your portfolio will “last” a lot longer at a given level of spending. A portfolio’s “estimated longevity” (EL) can be calculated as a function of the expected real return of the portfolio (g) and real spending rate (r) using the following formula:
EL = (1/g) * ln(r/(r-g))
As shown below, using the current -1.0% yield on the 10-year TIPS to approximate the average yield of a laddered TIPS portfolio indicates that a 4% spending rate would be depleted in 22.3 years. This is not nearly long enough to fund the expected retirement for most of today’s retirees.
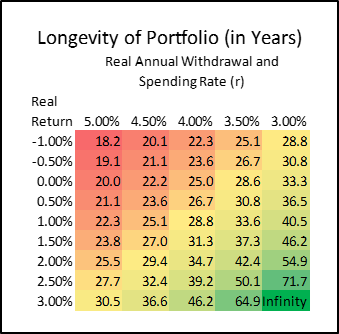
On the other hand, higher levels of real return would allow for combinations of higher spending levels and/or longer estimated longevity. A portfolio with a 3.0% real return could support a real spending rate of 3% forever. Given today’s expected returns on stocks and bonds, what is realistic?
Realistic Expected Returns for Stocks and Bonds
The table below provides an estimate of expected return for a 60/40 stocks/bonds balanced portfolio. The S&P 500 is used to benchmark stocks. The 10-Year Treasury Bond is used to benchmark bonds. (An aggregate government/corporate bond index is not used since corporate bonds share default risk with stocks and are therefore a hybrid stock/bond security.)
Above we mentioned the fact that the expected return for a bond or a bond portfolio is a straightforward calculation of its yield-to-maturity. We are using the 10-Year Treasury Bond, which currently has a yield of 0.7%.
Stocks, like bonds and all other financial instruments, have an intrinsic value equal to the present discounted value of future cash flows. Unlike bonds, where the cash flows are known in advance, cash flows for stocks (dividends) are not contractual, and tend to grow over time, which makes forecasting stock returns much more difficult than forecasting bond returns.
The total return for stocks can be separated into two components: dividend income and capital appreciation (change in price), which over the long term is based upon the dividend growth rate. The reason that capital appreciation ultimately depends on the dividend growth rate is that dividends are the cash flows that give a stock its value. If I hold a stock forever, my return is the dividends I collect. If I sell the stock to someone, the price the buyer is willing to pay is determined by the long-term dividend flow the stock will generate discounted at an appropriate rate. Using a combination of historical dividend growth rates, consensus real GDP growth rates, and Treasury-TIPS implied inflation expectations, a reasonable nominal growth expectation for the S&P 500 is about 5.0%. Together with the (rounded up) current yield of 2.0% results in a total expected nominal return for stocks of 7.0%.
A 60/40 portfolio of 7.0% return stocks and .7% return bonds results in an expected portfolio return of 4.5%. From this nominal return forecast we subtract the 2.0% inflation (which is the Fed target average rate), leaving a real return forecast of 2.5%. Most investors pay some fees to funds and investment advisors, but we keep them low at only 0.5%, resulting in a net real return of 2.0%. Assuming a fairly low combined federal and state income tax rate of 25% leaves the bottom line net real after-tax return at 1.5%.

Given the assumptions of the table above, a 1.5% real, after-tax rate of return (g) is realistic. From the Longevity chart above, this return would support a spending rate of 4% for 31.3 years if the returns had limited volatility and you could be sure of them. However, life is uncertain, and returns are especially uncertain. That being the case, and since neither lifespan nor returns can be forecast with much accuracy, prudence dictates building in considerable leeway with regard to average returns, their volatility, and life expectancy. If 30 years is the upper limit of the expected horizon, perhaps a spending rate of 3.5% would be more prudent, since it would only require an average real return of about 0.5%.
The reason that you can spend 3.5% per year in real terms with an inflation-adjusted portfolio return of only 0.5% is that a lot of the spending is financed by drawing down your original capital. In nominal terms, your original capital would support spending of 3.33% per year over 30 years, but some real growth is required to maintain a real spending rate of 3.5%. Depending upon your other sources of retirement income, such as Social Security, a pension, and perhaps part-time employment, 3.5% per year in real terms may be sufficient. But for those who need to stretch every dollar of their retirement portfolio, the most effective solution is often an income annuity.
A Helpful Retirement Tool: Income Annuities
Historically, many employers used to provide retirement income through defined benefit pension plans. Typically, these plans provided a fixed amount of monthly income to a retiree for the rest of his or her life, often with benefits continuing for a surviving spouse. A few plans even had cost-of-living adjustments.
Over time, most employers have done away with these traditional pension plans in favor of defined contribution (401k-type) pension plans with the employee/retiree responsible for both the accumulation phase (during active employment) and the decumulation phase (in retirement). However, at the point of retirement, retirees are faced with the problem of turning their accumulated pot of retirement money into a monthly income for the rest of their lives.
The first problem is that nobody knows how long they are going to live. It is possible to get a reasonable point estimate of your life expectancy based upon a questionnaire, as well as a life expectancy range. Armed with that information, at least you have a rough idea of the amount of time you need to plan for.
Still, nobody knows when they will have their appointment with the grim reaper. It is a classic problem situation for which insurance can provide an ideal solution. The insurance company doesn’t know how long any one individual will live, but through the law of large numbers, they have a pretty good idea of the likely average life expectancy of a large group. They can underwrite annuity policies based on that knowledge and everyone in the group pays a fair premium for their annuity which takes away some of the risk of outliving their money. Research indicates that pooling longevity risk through the purchase of an annuity costs about 35% less than the amount that would be required to provide the same benefit through age 105 (the assumed maximum lifetime).
I even have a recommendation for the best place to shop for an annuity: Blueprint Income, an online portal for comparing annuities among a number of A+ rated providers. (Income Solutions is a similar source.) As of May 1, 2020, Blueprint Income has partnered with AARP to provide an AARP-branded annuity marketplace. However, you do not have to be an AARP member to use it. Importantly, Blueprint Income provides only “simple annuities” with identical or highly similar terms which facilitates easy comparison shopping. They do not offer variable annuities or complex index-linked annuities, which are usually more expensive and have a bewildering array of terms and options.
Specifically, the type of annuities that provide steady income over a retiree’s lifetime are “income annuities.” There are three types of income annuities. All provide a steady, guaranteed paycheck for life, but they differ in when the income begins and the source of the money used to fund them. The three types of income annuities are:
- Immediate Annuities: For those about to retire or already retired, immediate annuities provide income starting within 12 months.
- Longevity Annuities: For those farther from retirement or early in retirement, longevity annuities provide income starting more than 1 year from now (often at age 85).
- Qualified Longevity Annuity Contracts (QLACs): For those looking to defer IRA required minimum distributions, QLACs are longevity annuities purchased with (up to $135,000 of) traditional IRA savings with income starting after age 72 but before 85.
By far the most common of these three are immediate annuities. They are usually purchased with a single payment (or premium), and are often called "single premium immediate annuities" (SPIAs). As mentioned above, by taking advantage of the pooling of longevity risks, this type of annuity can be expected to boost retirement income by about 35% compared to self-funding. However, retirees are not using income annuities as much as they optimally should. The reasons are probably a combination of these three concerns:
- Lack of liquidity and control. When you purchase an annuity, you give a chunk of money to the insurance company in exchange for their promise to pay you a certain monthly amount over your lifetime. No changes are possible. You are locked in. (So are they, of course.)
- High costs and low payout rates. Insurance companies compete for your annuity business through the payout rates that they quote, but all of them have operating costs that are built into their rate quotes. Since they tend to invest very conservatively (by inclination and because regulators force them to), the payout rates are closely tied to the interest rates on government and investment-grade corporate bonds that make up the bulk of their portfolios.
- Default risk. Although insurance companies are highly regulated and conservatively managed, there is a very small risk that they might go bankrupt before they are finished paying you. Even an A+ rated insurer has at least a slight risk of default, especially over a period that is decades long.
Despite these concerns, retirees should seriously consider the advantages of allocating at least part of their retirement assets to some form of annuity in order to reduce both market and longevity risks. One study used sophisticated optimization techniques to derive the best return/risk portfolios by selecting among the following options for retirement investment:
- Stocks (S&P 500)
- Bonds (TIPS)
- Inflation-adjusted single premium immediate annuities (no longer available)
- Fixed single premium immediate annuities
- Variable annuities with guaranteed living benefit riders
Regardless of risk preferences, the author found that a 10% allocation to a fixed single premium immediate annuity (SPIA) with the remaining 90% allocated to equities dominated even a 100% equity portfolio in terms of return/risk tradeoffs. (A “dominating” asset or asset combination is always better no matter the risk preference.) Fixed SPIAs dominated all other non-equity assets. That is, the best combinations of assets were always combinations of fixed SPIAs and equities, with no allocations to bonds, Inflation-adjusted SPIAs, or variable annuities ever selected as optimal.
One conclusion is that retirees should allocate at least 10% of their retirement portfolios to fixed SPIAs, and probably more depending upon their risk tolerance and long-term objectives.
The Best Annuity of All: Social Security
In theory, you would ideally want an annuity that protects you from both longevity risk (the risk of outliving your money) and inflation risk (the risk that your money will become worth less and less over time). Until late in 2019, only one insurance company offered an inflation-adjusted lifetime annuity. Most companies stopped offering them a few years ago. Then last year, Principal Financial, the sole remaining provider, stopped selling them. (Matt Carey at Blueprint Income says that they “discontinued it due to a lack of demand and the difficulty of hedging the risk.”)
It turns out that this was not much of a loss for retirees. According to an article by David Blanchett, PhD, CFA, CFP and head of retirement research for Morningstar, the inflation-adjusted lifetime annuity was ridiculously expensive to buy. Competition matters. He estimated the “load” of a sample policy (cost – actuarial value of policy) at about 21.9%. With no competitors they could set the price high, and they did. By comparison, a 2% fixed inflation-adjusted lifetime annuity, where the payout increases at a constant 2% per year, had a load of only 8.1% from the lowest cost provider (there were 14 of them). Better yet, a lifetime annuity without any inflation adjustment at all had a load of just 5.9%, perhaps because there were 21 companies providing quotes. Ah competition!
So now the only place you can get an inflation-adjusted lifetime annuity is from the Social Security Administration. By far the cheapest form of “buying” longevity and inflation insurance has always been delaying Social Security until age 70. The fact that you can’t even buy that kind of benefit anymore makes maximizing your Social Security benefit by delaying to age 70 even more important.
Conclusions
- The “4% rule” of retirement spending is probably too aggressive given today’s low interest rates and elevated stock market prices.
- Both the average level of future portfolio returns and the volatility of returns (particularly in the early years of retirement) are extremely important in estimating a safe spending policy.
- Treasury Inflation Protected Securities (TIPS) are the only “risk-free” asset, since only they (and Social Security) protect against both loss of principal and loss of purchasing power.
- However, TIPS yields are extremely low (the 10Y is -1%!), supporting only low levels of spending.
- A 60/40 stocks/bond portfolio can be expected to provide a real, net, after-tax return of about 1.5% per year.
- However, returns are highly uncertain, so it would be more prudent to assume somewhat less, like 0.5%.
- That level of return could support a real spending rate of about 3.5% for about 30 years.
- If that is not enough to provide for a comfortable retirement, one way to stretch retirement income is with a single premium immediate annuity (SPIA). These take advantage of the pooling of longevity risks through insurance, and can boost retirement income by about 35% compared to self-funding.
- Sophisticated portfolio optimization studies indicate that allocating at least 10% of a retirement portfolio to an SPIA is optimal in order to reduce market and longevity risks.
- Delaying the claiming of Social Security benefits until age 70 is the single most attractive “investment” in an annuity, and it is the only one that provides inflation-adjusted payments.